
О блоге
studio – здесь будем говорить про звукозапись. Какой мик использовать? Как его ставить? Ди-бокс? Микшер? Как подключать, коммутировать итд итп… В общем, все вопросы, связанные с записью звука. Т.е. как и чем записать звук и все, что с этим связано.
Администраторы (1)
Модераторы (0)
Модераторов здесь не замеченоЧитатели (121)
openid.yandex.ru-gorbadima, papa, Mandjzi, Sun, maxim_ya, n4nn31355, DEmelyanov, NIKosh, annafoxylady, sanyiteam, indyboy, GuitarMan55, FedorFender, hldreplic, terror2006, Molchynn, kaban, JimmiMontgomerry, motion2freedom, Zecht,Все читатели блога
studio /
Обновление Peavey ReValver. Новые модули ACT позволяют клонировать звук любого усилителя
 Ну, не ново, конечно, но полезно. Подобные фишки «клонирования» есть уже. Например в Kemper или Positive Grid BIAS.
Итак, в новом обновлении нас ждут 2 новых модуля ACT Combo и ACT Rack. Первый как раз предназначен для клонирования звука с любого усилителя, а второй может анализировать спектр ранее записанного сигнала, а потом применять параметры эквализации этого сигнала для вашего трека.
Читать дальше →
- CraSS,
- 11 августа 2016, 15:25,
- Комментировать
- 0
studio /
Как играть, как Джон Маклафлин
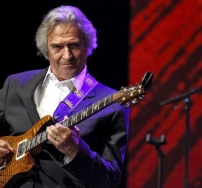 Карьеру Джона Маклафлина можно сравнить с историей современного джаза и различных гибридный стилей, и именно поэтому, Джон – не тот музыкант, которого можно охарактеризовать несколькими небольшими примерами.
Мы взяли один конкретный плодотворный творческий период с конца 60х до середины 70х. Тот период, когда были выработаны многие его идеи, получившие развитие в его дальнейшей карьере.
В период с 1969 по 1971 Маклафлин записал три сольный альбома: Extrapolation, Devotion и My Goal's Beyond. Они разнообразны и показывают его творческий путь в движении от рядового участника команды Майлса Дэвиса до лидера Mahavishnu.
Второй из перечисленный альбомов несколько жестковат, он даёт понимание того, что придет вместе с Mahavishnu Orchestra. Этот жёсткий фьюжн Mahavishnu, плюс ко всему, смешивает в себе индийские ритмы и музыкальные лады западной музыки.
Читать дальше →
- CraSS,
- 24 мая 2016, 14:34,
- Комментировать
- 0
studio /
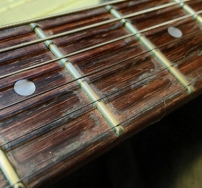
Звукосниматели для акустической гитары
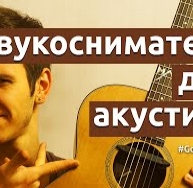 Какой звукосниматель для акустической гитары выбрать? Какие они бывают? Чем отличаются? На что обращать внимание?
 Пожалуй, самая нераскрытая тема в сообществе акустических гитаристов. По крайней мере, когда я сталкнулся с выбором датчика, информации на русском языке было чрезвычайно мало. Поэтому с радостью делюсь с вами своим опытом, опытом своих друзей и кумиров.
Читать дальше →
- Максим Ярушкин,
- 20 мая 2016, 17:05,
- 1
- 0
studio /
Ibanez Tube Screamer на котором играл Stevie Ray Vaughan высатвлен на продажу
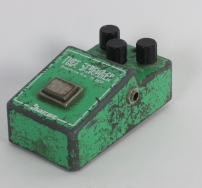 Да-да, один из тех самых Тьюб Скримеров, на котором Стиви играл многие свои хиты. Продается эта легендарная примочка в Сиэтле в магазине Emerald City Guitars.
Как говорят, после смерти SRV в 1990м, его гитарный техник Cesar Diaz продал два Скримера, принадлежавших Стиви. И вот этот как раз один из них. Скример боевой, со шрамами, но полностью работоспособный.
Читать дальше →
- CraSS,
- 11 марта 2016, 15:43,
- Комментировать
- 0
studio /
Запись гитары: стоит ли менять струны перед записью
 Если твои струны уже затвердели от грязи, ты можешь их сварить и приготовить супчик....
Эй! Помнишь тот заголовок в гитарном журнале о подготовке к студийной работе? Тот самый, который говорит, что всегда следует менять струны перед записью инструмента, потому что тебе нужен яркий, громкий, наиболее верно интонированный звук?
Затем там была колонка, которая говорила избегать смены струн в последний момент перед записью любой ценой, потому что хорошо раскаченные струны обеспечивают более стабильный строй, плотную динамику и меньше скрежета от пальцев.
Так кто же прав? Ответ стандартный: ни «А» ни «Б» ответом: «Оба варианта верные – и все зависит от ситуации». Так давайте же послушаем разницу и объективно рассмотрим эти ситуации.
Читать дальше →
- ErMeliZ,
- 07 февраля 2016, 17:54,
- Комментировать
- +2
studio /
Сравнение 18 микрофонов для снятия гитарного звука
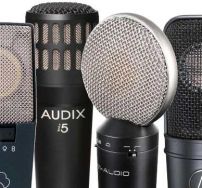 Записывается 2 гитарных лика, один на чистом, другой на перегрузе. Все лики играются в средней позиции звукоснимателей.
Американский стандартный Телекастер ранних 90-ых — Преамп-Дибокс Creation Audio Lab MW1 — Звуковая карта Pro Tools HD. С карты звук шел в голову Mesa Boogie MKIV (На полной мощности, в режиме триода) — Кабиент Mesa 4х12 с динамиками Black Shadow (тоже Mesa) — микрофон. Всё записывается в A-образной комнате.
Читать дальше →
studio /
Stairway to Heaven (Solo) - Led Zeppelin - Подробный разбор! Pt.I (ТЕКСТ)
 Всем привет!
Предлагаю Вам ознакомиться с подробным видео разбором
Stairway to Heaven (Solo) — Led Zeppelin
Подробный таймкод по каждой фразе по частям на канале YouTube!
Буду рад, если подобный разбор окажется полезным!)
Читать дальше →
studio /
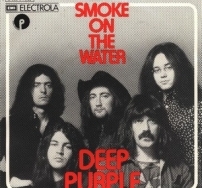
Smoke On The Water Solo - Подробный разбор! Pt II (РИТМИКА)
 Всем привет!
Предлагаю Вам ознакомиться с подробным видео разбором Smoke On The Water — Deep Purple.
ЭТО ВТОРАЯ ЧАСТЬ ВИДЕО С РАЗБОРОМ РИТМИКИ!
Подробный таймкод по каждой фразе по частям на канале youtube!
Буду рад, если подобный разбор окажется полезным!)
Читать дальше →
- papa,
- 26 июля 2015, 01:24,
- Комментировать
- 0
studio /
Реампинг онлайн
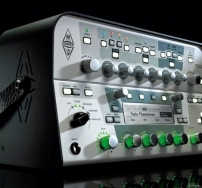 Про Kemper Profiling Amplifier в гитарном мире, наверно, слышали если не все, то почти все. Прибор дорогой, но, как говорят, настолько же хороший. Также те, кто интересуются записью гитары, знают, что такое реампинг (reamping), если нет, то гугл в помощь.
Самый простой способ менять звук записанного трека – это использовать VST на «голую гитару». VST-плагинов много и очень много, но вот VST с алгоритмами Kemper нет. И что делать, если хочется использовать Kemper, а денег на него нет?
Читать дальше →